THE
STRATEGIC
PLANNING
SOCIETY
17 Portland Place London W1N 3AF Telephone 0171 636 7737 Fax 0171 323 1692
Registered Office: 17 Queen Square London WC1N 3RH
PROCEEDINGS OF THE BUSINESS FUTURES STUDY GROUP
(FORMERLY THE BUSINESS ENVIRONMENT STUDY GROUP)
FORECASTING
Edited by
Dr Richard Whaley
Better Management through Planning
FORECASTING
CONTENTS
Introduction 3
Trend Extrapolation 5
Market Research 8
Environmental Assessment and Surveillence 11
Product Cycles, Envelope Curves and Substitution Processes 16
Modelling (including) 19
Computers 21
Systems Analysis 23
Input - Output Models 24
Correlations, Regression Analysis 25
Economic Models 29
Scenario Writing 33
Delphi and Panel Methods 35
Creative Methods 37
Morphological Research 37
Cross Impact Anaysis 38
Averaging Published Forecasts 40
Historical Analysis 42
Normative and Relevance Trees 44
Application of Methods 46
Use of Business Environment Information 51
Study Group Membership 55
INTRODUCTION
This review of the business uses of forecasting techniques and conclusions is drawn from the work of the BUSINESS ENVIRONMENT STUDY GROUP of the Strategic Planning Society.
The method of this review was similar to that for other topics which the group has looked at. Some 20 forecasting methods were identified, and grouped into related methods. Speakers from inside and outside the Study Group gave presentations on the various methods.
In this Publication, mirroring the various presentations, a description of each method is given, sufficient to understand what it is about. In many cases this will be sufficient for people to make use of the method themselves - but this Publication does not claim to present a definitive description of each method - in most cases books have been written on individual methods. References are given to where specialist help may be needed in using particular methods, and where to find further information. The Study set out to review which methods are used, which are valuable, their pit falls, and the use of different methods to tackle common problems. These conclusions are presented.
The Study Group then went on to consider the extent to which a particular method was used, its successes, failures points, and attempted to catalogue good or best practice. Some methods were used a lot, a few were thought to be little used but nevertheless to have applications. A low level of skill in use of several methods was evident, with dangerous consequences: examples were cited.
A theme was developed in the study that the output from forecasting should frequently assess uncertainty, rather than concentrate on single line or single figure forecasts - which are almost always going to be wrong. Ways were seen to be available to define bounds within which actual out-turns over time are likely to occur - and these may often be more important to strategy formation than the size of the forecast event.
The Study Group desired to form an account of good practice in the mixed use of various forecasting methods in concert to tackle common business problems. There seemed, however, to be a dearth of such practice - except in the field of scenario planning. The forecasting method based on writing scenarios seems to have evolved into a well developed forecasting-planning system - which draws heavily on other forecasting methods. Apart from this, it was concluded that relying on one method on its own was often dangerous, but a best practice in use of forecasting methods in concert has yet to evolve. A number of cases where methods relate to each other is described.
Note about the Study Group
Meeting once or twice a month in the early evening, the study group is not equipped to carry out research as such. It does however provide a means of distilling corporate planning and allied opinion. Basically members pool their own work and experiences. This is useful for planners to confirm aspects of their work with others, and for newcomers to pick up some of the concepts.
A surprisingly high level of consensus is normally reached following discussion. This study group is unusual in having an opportunity to discuss a speaker's input on another occasion, often in the absence of the speaker. Such speaker's contributions are very valuable in providing an over-view and detailed information - but it is quite common for the Study Group to end up disagreeing with some or a lot of what the speakers said.
Traditionally, after a series of meeting on a topic, the study group has held a days seminar for the society, and then issued a publication on the meeting and seminar. The seminar was held in June 1990. The participants regarded it more as a training exercise in forecasting, and not a lot of new thinking emerged. A training exercise may be repeated based on the publication.
This publication was compiled over 1993-6. Each of the meetings was reviewed again from the records of the 1988/9 meetings and the 1990 seminar - and new thinking emerged.
Richard Whaley
Chairman
Business Futures Group
btl1pcil at aol.co.uk
TREND EXTRAPOLATION
The most common method - one is simply continuing on a graph into the future.
Description
The method is one of the oldest, dating especially as the use of statistics in business caused graphs to be plotted from data. In its simplest form an estimate is made from the shape of the curve as to how it will continue into the future. Computer packages are available that claim to refine the extrapolation process. They generally search for some mathematical function - and in this way continue the curve on into the future.
Some method of smoothing the data must often be employed. For example, if monthly data is employed, plotting a 3 month moving average may give a more usable graph. In quite a lot of Government produced data the latest available figures will change in subsequent issues of the same data. It can be useful to treat such recent data as a half way house between firm actual figures, and the forecasts. It may take several years for a particular data point to settle down at a constant value. Balance of payment figures are a notorious example - many of the post-war recessions which at the time featured massive Current Account deficits can now be seen to have been based on false data. Modern figures on the great depression of the 1930's show economic growth continuing for most of the years - but this was not what people were told at the time. See further discussion of this under Economic Models.
Applications
The method is applied whenever data is available over time and can be plotted on a graph, or a time series suitable to be analysed by a common computer package. Within these, its application can be very wide. In its simpler manual form it may not matter if the data is not continuous. The growth of a particular market can be dealt with even if some data is missing. Firm's sales and many other like time series are applications.
Limitations
The Study Group concluded that using this method on its own can be dangerous. There is no way of knowing if the curve will continue in its past form, and does not immediately lend itself to building an expression of uncertainty into it. Computer packages may give false confidence, and if the mathematical functions for which they seek are not present in the data spurious results may be given.
The Study Group considered that you should take any computer package apart to find out exactly what it does - and make judgements on the plausibility to your problem. Unfortunately, you may need knowledge of mathematics to do this - and quite possibly computer programming. If in any doubt one should stick to what one understands, and use the simpler manual methods.
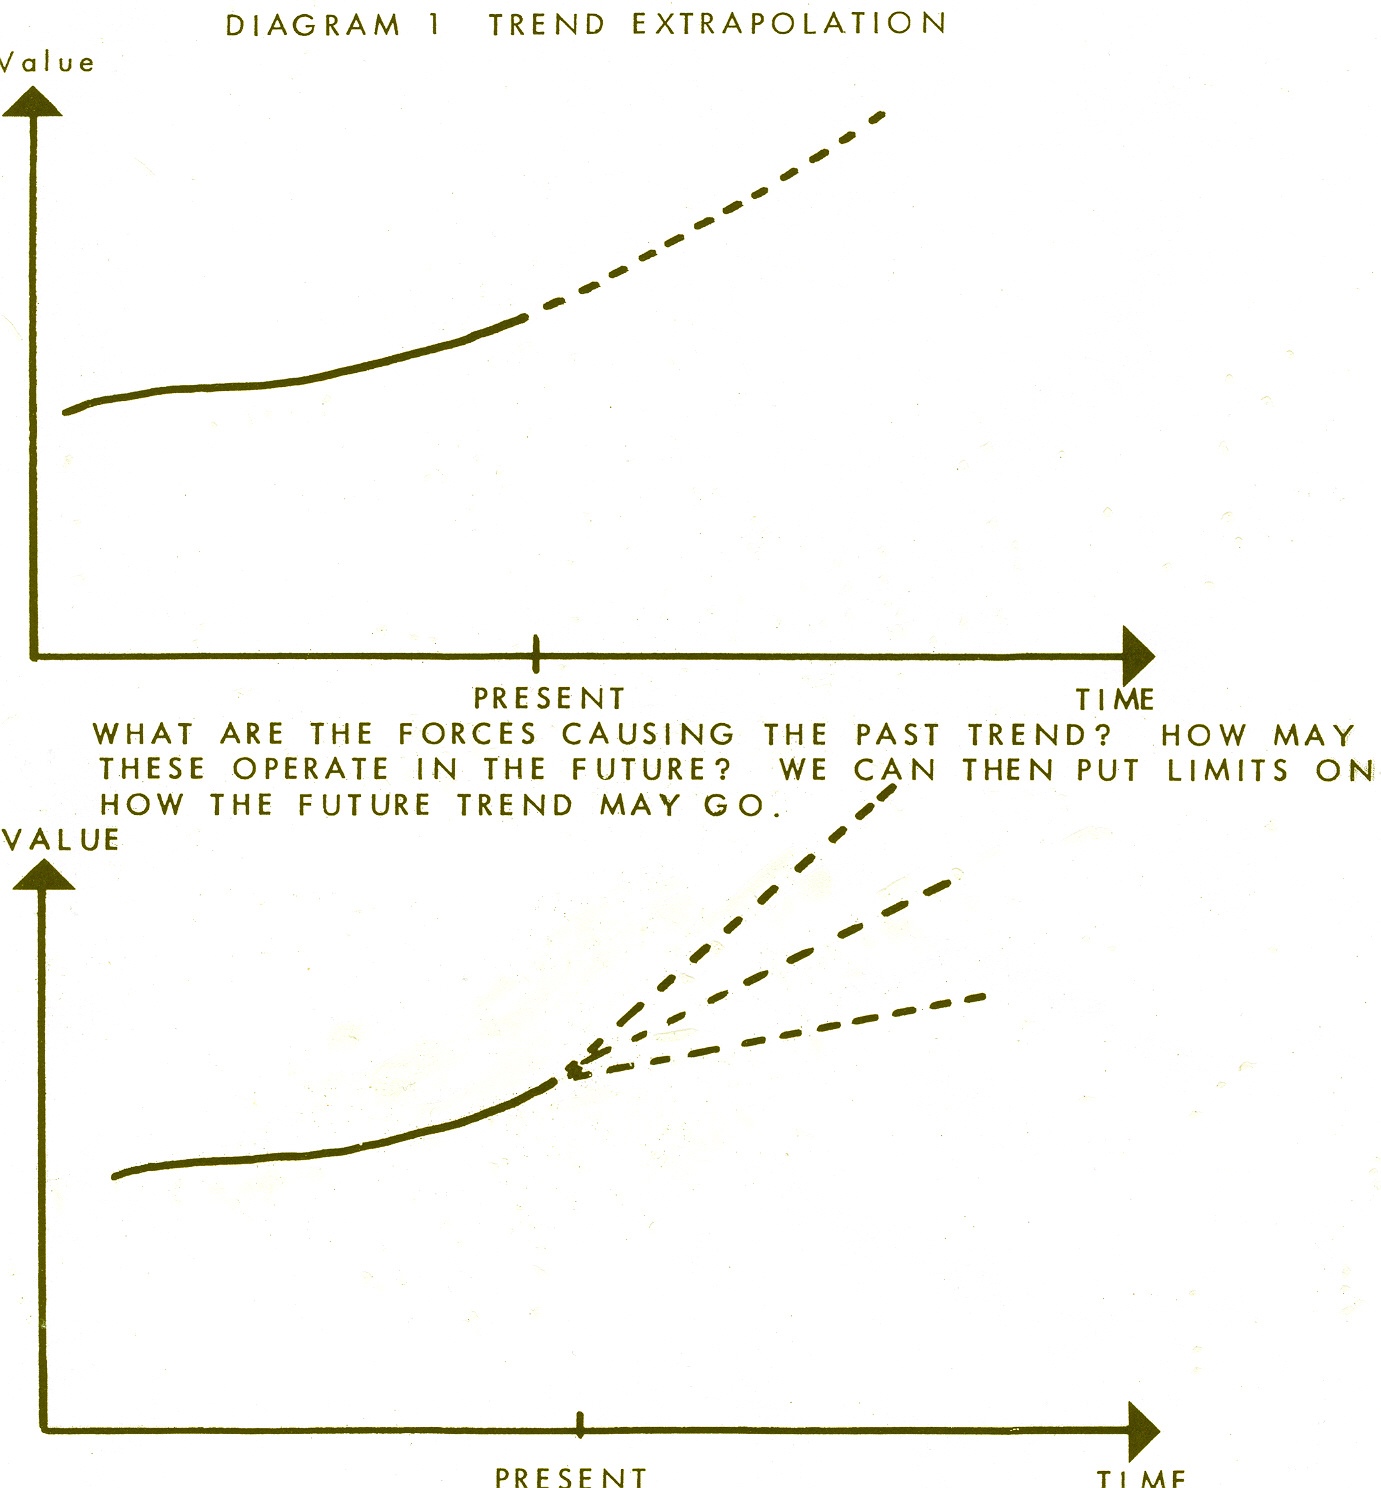
It is necessary to use this method in conjunction with other methods - one of the themes and objectives of the series of meetings. Richard Whaley who led the discussion, presented some examples. Knowledge of the underlying trends enables judgements to be made about the extent to which the pattern of data seen in the past will continue - or be allowed - together with possible ranges. These enable us to begin the construction of an Uncertainty Envelope. For it's generally more important to have as realistic as possible assessment of the ranges where the actual future out-turn will be, than trying to construct one-line forecasts (which are bound to be wrong nearly all the time). The diagrams illustrate taking traditional Trend Extrapolation into an adaptation to an Uncertainty Envelope.
Knowledge of the underlying trends must come from other methods. If when contemplating a Trend Extrapolation such methods have not been used, then a simple approach is to try and think up all the Trends which could impact (q.v.) upon the Extrapolation question - giving as much time to this as possible. It is often the case that the Underlying Trends may be quite complicated in their operation.
An example was given from Long Range Planning Journal 17, No 4 P87 1984. In anything but the short term it may often be found that this is the more important area to tackle first.
There are simple graphical methods for setting estimates described in the above Reference, leading to the example of married women in work which was reproduced. Boundary Conditions should always be considered - where a trend will cause the data to end up, and ranges of how fast or slow it takes to get there, are ingredients in the Uncertainty Envelope construction. Naturally, one monitors actual out-turns and compares with the limits put on the Uncertainty Envelope - adjusting accordingly - but also appraising and increasing ones skill in controlling them.
S curves will often be involved (see Product Cycles) - since in practice much business data follows them. These are good examples where simple extrapolation may go completely wrong.
The issue was raised that you should not extrapolate further ahead than the past data. This is a possible rule of thumb. There must be enough past data to overcome any cyclic trends. At least several decades of data is desirable, with more if possible. It does not matter if it is not continuous - and unusual periods may be best omitted - such as World Wars. It is suggested above that impacts occurring in the future may be the main determiner of the forecast - but impacts that have occurred in the past may be an important criteria of how far back one needs to go for data. An extract from Futures 17, p274-5 June 1985 was given showing what can go wrong with extrapolating even from 20 years data, if one is unaware of the Impacts which have occurred in the past - and have not collected data back far enough in time.
Extent of use
Widespread, but too often in its dangerous form, and people are prone to considerably over-estimate the speed with which things may happen, especially in new market growths.
Directors and other users of forecasts may expect simple line forecasts. But this may lead to the dangerous form. It is worth explaining to users of forecasts that single line forecasts can never be right - and that Trend Extrapolation should only lead to an Uncertainty Envelope. A business should be viable under a reasonable range of the Envelope, e.g. if a firm builds a new factory it should be viable under on the lower part of the Envelope - unless it is decided to deliberately take a strategic risk.
Further Information
The writer gave references to two papers which were distributed:
Richard Whaley Data Bank On The Future Business Environment
Long Range Planning 17, 83 1984
an extract of which was reproduced (p87).
Richard Whaley Interactions and Inputs Among Business Futures
17, 269 June 1985 An extract of which was reproduced (p274-5).
Richard Whaley September 1993, Revised August 1994
MARKET RESEARCH
Purpose
Market research is the gathering of information about the past and the expected future.
•
actual and potential customers and their purchasing behaviour•
life cycle and replacement data for products•
market sizes and characteristics•
competitors•
other external factors that might affect the organisation's performanceoften for the specific purpose of increasing profitable sales or determining likely sales volumes, etc. for planning purposes.
The data may also be used as an input to other forecasting models, particularly trend extrapolation.
Description
Market research covers the gathering of information external to the organisation to answer specific questions, for example what is our market share, what features do customers value in a product, how much of current sales are replacements, what will be the size of the overall market next year.
In addition some market research is carried out communally for a number of organisations by market research and consulting companies.
The origins of market research no doubt go back to the earliest days of trading though the use of formal methods may only date from the beginning of this century.
Many techniques are used, some of them described in their own right elsewhere in this report. They include both "book research" and interviews with potential customers and others, either in person or by telephone.
The selection of technique for a particular application generally follows from the type of questions the organisation is trying to throw light on. The choice of the questions themselves should be based on careful analysis, and perhaps modelling (particularly for medium and long range forcasting), to pin-point data which could affect decision making.
Thus trade and professional journals might be scanned for new developments or emerging trends or competitor activity. Data on the existing or installed market might be obtained from trade bodies or research organisations. Customers or others might be subjected to a structured interview or be asked to complete a questionnaire.
On more speculative issues such as future demand for new technologies sophisticated psychological probing might be employed or Delphi techniques used.
These activities might be undertaken by the organisation's own personnel or outside bodies might be employed. One frequently under-used source is the organisation's own sales force, whose members meet actual and potential customers regularly.
The cost and difficulty of gaining adequate information will vary greatly.
Applications
There are no hard and fast rules about when market research should be utilised, nor even which techniques should be chosen if research is to be employed.
Typical applications include:-
•
determining customer perceptions of the organisation's current offerings•
determining the needs of potential customers•
finding out potential customers' buying intentions•
comparisons between the organisation and its competitors•
external perceptions of the organisation•
likely reception of a proposed new product•
factors influencing customers' buying choices•
other external data such as on factors that could affect the choice of a new site or such as the likely future labour pool at current sites•
future market sizes•
price acceptability•
price trends•
input to other forecasting methods such as trend extrapolationIn fact here is virtually no limit to the information that might sensibly be sought by market research, though scepticism should be exercised on the reliability of data for long ahead or on new concepts.
In practice a great deal of market research could be justified as a precaution against upsets. Nearly all organisations will find that they will have to set an overall budget to contain spending and the choice then becomes how to allocate the spend most effectively. There are norms in many business sectors for the spend on market research.
Evaluation
One can surmise that a great deal of current market research is wasted due to poor initial thinking. Key factors to be considered before undertaking research are
•
what is the underlying issue to be illuminated?•
what are the key data required?•
what use that will be made of the results?•
what is the potential value of that information to the organisation? For repetitive surveys this may mean taking a long term view - such surveys can be of great value in detecting changes and trends.Certain potential limitations may need to be borne in mind:-
•
cost of the research•
elapsed time to carry out needed surveys•
customers frequently do not know their own motivation or intentions•
interviewees may not answer questions truthfully - to save thought, to give a favourable impression of themselves, or for other more mischievous reasons•
potential customers have difficulties in imagining new technological innovations•
key questions may be difficult to isolate•
impossibility of covering all aspects of the future that can influence outcomesGreat care should be taken in setting any questionnaires in that the exact wording will affect the answers obtained. Due allowance must also be made for human fallibility - including that of the interviewers! As an example it is commonly found that customers' actual purchases of new products are only 10% of the volumes they tell interviewers.
In some cases it has proved cheaper (and more reliable!) to test market a product than to carry out prior market research.
If the market researchers present their findings in the form of forecasts, it is usually vital for managers to know the model they have used (for the market, etc.) and what assumptions they have made.
Cases
There are innumerable examples of successful market research, though even the best market research does not necessarily lead to successful action by the organisation. One of the most famous examples of poorly utilised market research is the Ford Edsel car that supposedly incorporated all the features customers were believed to want, but which became a sales disaster.
A famous case of not carrying out needed market research was the UK's Postmaster General's dismissal of the market for the telephone when he said it would be superfluous in the UK as we already had good postal and message services.
Further Information
There are innumerable books on market research. Choice should be made of books covering the organisation's own circumstances as nearly as possible. For example a book looking at fast moving consumer goods would be of little use to an organisation selling capital goods or selling financial services.
Author
Donald Alexander - 20 August 1994
ENVIRONMENTAL ASSESSMENT
Identification of the features of the environment in which a particular business operates. Traditionally it has been divided into social, economic, technological and political trends, but factors developing the future of the firm's markets need also to be considered.
Description
The original description of the method is generally attributed to Aguilar (1967). Much statistical data on social, political, economic and market trends can be obtained from government statistical publications in parts of the world of interest - anyway for the advanced countries. Having assembled such readily available information, further additions are added over time by scanning relevant publications and other information sources, and clipping extracts into a suitable filing system. Newsletters are sometimes issued to those taking part in the exercise.
Applications
The object is to understand the evolution of ones industry and what's driving it, and other factors necessary to evolve strategy. The Study Group considered it was essential to undertake such assessment for strategic planning. To achieve this it is necessary to make forecasts of the future form of the Business Environment. This involves using many of the forecasting methods surveyed in this publication, and more will be said about this later.
Jain (1984) surveyed Fortune 500 US firms, identifying four phases of activity, which was largely related to the size of the firm.
Phase 1 The Environment was taken as random, without much order being identified or much could be done about the impacts on the firm identified. Difference between strategic and non-strategic information not identified. Most firms under $5B turnover were in this phase, but none of the firms over $5B were.
Phase 2 Areas are identified to watch carefully, but still may not be related to strategy.
Phase 3 Management recognises the importance of the environment, set up scanning but it's unstructured. Everything appears to be important, tends to produce too much information. Phase 3 firms tend to understand the problems and opportunities which the future holds, but are unwilling to take the first steps to react - but react fast when the market leader makes a move. Between $1 - 5B turnover firms were in this Phase.
Phase 4 Environmental scanning with vigour and zeal with structured effort on specialised areas considered crucial. Time is taken to produce a proper methodology, to disseminate and incorporate into strategy. Micro scanning at Strategic Business Unit level, tied into Corporate level. Only in this Phase is the attempts to forecast the future environment. Over $5B turnover, more firms in this Phase.
Environmental Assessment forms a data bank on which other Forecasting Methods draw - such as Trend Extrapolation. It also forms the basis for a Strategic Data Bank, considered later.
Limitations and Evaluations
Scanning all manner of publications and information sources for all material relevant to the business can tend to produce a large amount of paper from which it is difficult to see relevance. It helps a lot if you already have a good picture of where your world is going - when it can throw up weak signals of new developments.
This however implies you must be high up on Jain's Phrases. It was an objective of this study to identify best practice to Forecasting the Business Environment. As discussed later, this was not achieved. The position may be that , as indicated above, only the world's largest firms and consultants are doing the exercise at a significantly high Phases level, and keep their methods confidential. Consultants are a source of information, and the trend probably is for Consultants to supply more of the information, even to the largest firms. Use of Consultants to get started is a way of cutting out the lower Phases, which may be unproductive.
The Study Group's publication "Business Futures" may form a starting point.
References and Further Reading
F.J. Aguilar Scanning the Business Environment Collier
MacMillian 1967
S.C. Jain Long Range Planning Journal 17, No 2, April 1984 P117
R.H.G. Whaley (Editor) Business Futures Strategic Planning Society 1989
See also
RHG Whaley Data Bank on the Future Business Environment
Long Range Planning Journal 17, P83, 1984
SURVEILLANCE
An extension of Environmental Assessment, to monitor a firm's competitors
Description
The Study Group concluded that competitor analysis is vital, to establish a competitive league table. This enables the competitive advantage of the various firms to be deduced, including one's own firm.
Surveillance is not really a forecasting method itself, but a firm's competitive advantage in relation to its competitors determines its market share trend - hence is central to a firm's future performance and strategy - so the whole process has an important forecasting element.
The parallel in Military Planning is Military Intelligence, with the underworld of spies and obtaining information by almost any means. However, even in warfare, most societies in history have made rules for its conduct. In considering how far one should go in business surveillance the Study Group thought one should operate within the legal and ethical framework. Some actions on the dividing line were a matter of convention: it was permissible to hire people from competitors, but not to interview them merely to try and obtain intelligence.
A very great deal can be done within the modern rules. The starting point should usually be analysis of competitors' accounts, going back over a number of years. It is possible to understand a great deal about a business by this means, where it adds value, where it is weak compared with its competitors. Most management courses contain instruction on this and most qualified accountants will be skilled in this - but not necessarily the most effective. Information specialists provide key financial ratios of firms in an industry, from which it is possible to see how a firm differs from its industry average - giving indications of strengths and weaknesses - including one's own. A visit to a firm after getting a picture from its accounts can be rewarding. With a large scale map it is perfectly permissible to walk or driving round its boundary, to lunch in the pub across the road.
The Environmental scanning process can be extended to gather information about competitor firms. Some will be found to be more active than others - announcing innovations, new services and so on. Including competitor annual Report and Accounts in such scans is necessary. Firms may develop secret technological processes, but they can seldom refrain from mentioning the successful ones to their shareholders and the financial markets.
One method is to hold regular competitor analysis workshops. Salesmen generally have a great deal of knowledge about the performance of competitor's products and services - and these should be tapped. Nowadays there is considerable mobility of personnel around an industry. A firm is likely to have personnel at many levels who have worked for most other firms in the industry. Shop floor people will have comparative knowledge of the efficiency of the production processes of most of the competitors.
Generally the largest firm in an industry is found to be the lowest cost producer and has the largest market share. The reason for this low cost production should be ascertained. It may be the largest firm has better economies of scale. Generally however it has other competitive advantages - technology, more efficient management, good service and attention to customer needs, or the first to spot market changes and react to them, etc.
The other firms in an industry will have weaker competitive positions, though many may be distinctive in their own way - possibly serving niche markets. A feature of an industry or market which is in growth (on the rising part of an S-Curve) is that most of the firms in the market are profitable - though they may have high investment requirements to meet the growing demand, and may have negative cash-flows. When the Product Cycle S-Curve reaches the plateau there is a tendency for the tail-end firms in the Competitive ranking to become unprofitable. The reason is that most firms fail to forecast the plateau of the Product Cycle, lay down too much productive capacity on the erroneous assumption that demand growth will continue, turning the whole market into over-capacity, prices will fall, and only the lower cost producers being profitable. Product Cycles are discussed in the next Forecasting method - the point we are talking about here being Market Turbulence. Thus this work in Surveillance of an industry can help fix the point on the Product Cycle that the firm's market is in. It is of the utmost importance for strategy and survival.
When the Plateau of the Product Cycle has been going for some time the firms in the market adjust their investment levels accordingly, and more of them will become profitable. When the decline phase of the Product Cycle sets in, once again the tail-end firms become unprofitable. Now there is less business to be had as the years go by, and successively these least competitive firms go out of business. This pattern is thus recognisable from industry surveillance. It underlines the importance of Competitive Advantage and Market Share.
Applications
Most management and marketing courses underline the need for Competitive Advantage, and Market Share, and hence the necessity of collecting information described here. However, the reality according to Payne and Lumsden (1987) is that firms which have analysed their competitors and the evolution of their industry are virtually nil.
The methods are however used extensively in mergers and acquisitions work, both to select likely candidates, and detailed investigations prior to a bid. Judging by surprises often found in acquired firms - especially in foreign acquisitions - accuracy is often wanting. Doing such work in a hurry is probably the reason. Doing Surveillance over a long period of time, involving people knowledgeable of the industry and firms, has more chance of putting pieces of the jig-saw together.
Limitations and Evaluation
Given time and resources an adequate picture of one's competitors can usually be obtained. But it may not be possible to do this very quickly. The need to work within legal and ethical limits, the need to interpret the information, to make informed guesses about things which are commercially secret which will take time to be confirmed by publicly available information, mitigate an instant result.
Reference
Pain and Lumsden Long Range Planning 20, No 3, 1987
Richard Whaley November 1995
PRODUCT LIFE CYCLES AND ENVELOPE CURVES
Product Life Cycles
Product Life Cycles can be defined as a means of plotting the growth and decline of a specific product in graphical form. It can also be used to compare one product which may be declining with the growth of another product so that product substitution can take place in time so that the future of the organisation is not threatened.
The need to study and use product life cycles is now of greater importance than ever as we are in a period of rapid change. This is shortening the life cycle of many products.
In the past many organisations lived and died with the products they made. It was possible for firms to extend the life cycle of their products by better design or improved production methods. Introducing a new product which did not fit the culture of the organisation proved to be one of great difficulty. For example it was the electronic sector which developed automated controls for machine tools and not the machine tool industry. Also it has been found that the larger the organisation the more difficult it is to measure the life cycle of products and to substitute new products to replace declining sales of existing products.
One area which must be committed to product life cycles and substation is the electronic and information technology sector. Firms developing new products in this sector have spent the first few years in establishing the new product then making a great deal of money for a few years only to find a rival firm developing a new product. There are a large number of firms here who, because they did not monitor the life cycle of their product, are no longer trading. Thus the life cycle of a start up company in this sector can be a little as five years.
Envelope Curves
S curves have been used for forecasting for a long while. An S curve implies a slow start, a steep growth and then a plateau. Its main use has been in technological and sales forecasting.
Where a number of S curves form a related set, they can be combined into an Envelope Curve. A related set for example would be successive technologies serving the same output - stage coaches took over from feet, but were themselves taken over by motor cars, trains, then aeroplanes. Each of these modes of transport had an S curve of say the miles per day possible. These miles per day tended to increase as the mode of transport developed, but each reached a plateau.. An Envelope Curve measures the overall increase in transport speed as successive transport technologies developed.
By connecting the tangent of each of the initial growth curves an envelope S curve can be developed. This widens the parameters in forecasting so that a wider and more imaginative view can be developed. It also makes it easier to be aware of uncertainty which is always with us. However in recent years, with the rapid changes in technology and social attitudes, uncertainty has greatly increased. Thus the combination of product life cycles and envelope curves can improve forecasting.
Presentation by Peter Brown to The Business Environment Study Group and to the conference on forecasting.
Peter Brown, Chairman and Managing Director of Rhopoint Ltd, firmly believes that improved methods of life cycle measurement which he sees are vital to the future and success of his firm.
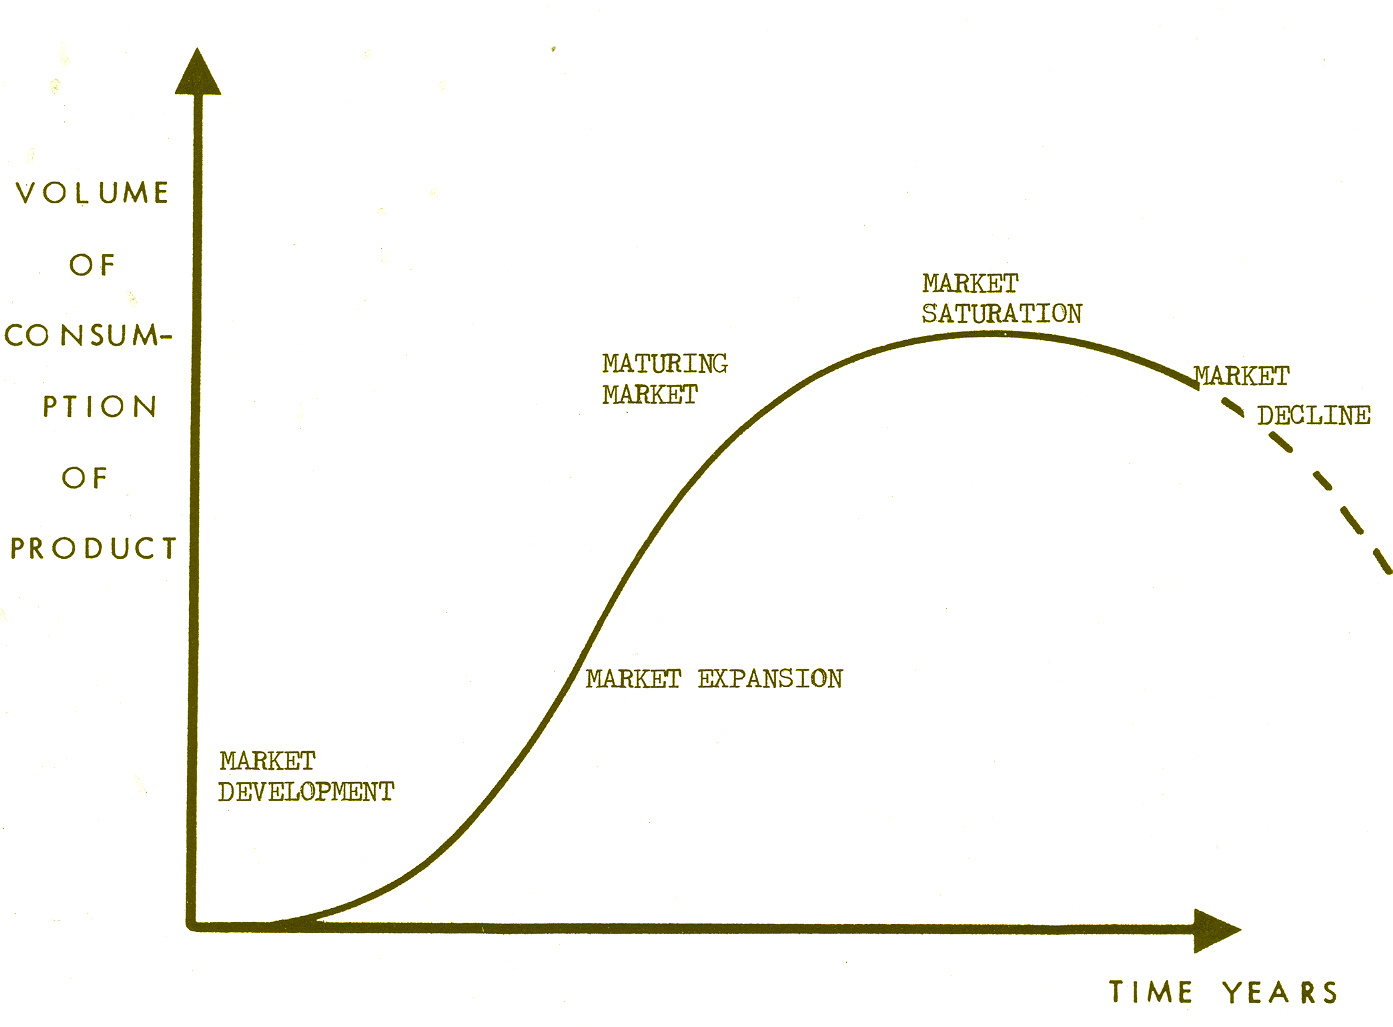
The product life cycle is an important factor in developing a corporate strategy. There is a parallel with biological systems as both go through the phases of birth, growth, adolescence, maturity, old age and death as illustrated below.
Biological Phases Business Phases
1 Birth Market Development/Introduction
2 Growth Market Expansion
3 Adolescence Market Turbulence
4 Maturity Market Saturation
5 Old Age Market Decline
6 Death Zero sales and end of firm
Phases 1 to 3 of the business phase can be defined as the S curve and the areas for debate include the effect of pricing, cost, behaviour distribution and competitive behaviour. What is difficult is to forecast the transition points from one phase to another.
1) Market Development
Testing the market is one a great difficulty and needs to be linked with market research. Sales will likely to be slow at first. In fact it has been found that the slower the initial sales of a product the longer will be the likely life cycle of the product. Also there needs to be a cut off point at which it is seen that the product has not been successful. Unless this is done great expenditure can occur on a failed product.
2) Market Expansion
This can only be successful if based on good market research in identifying where the market is, good promotion and good follow up services
3) Market Turbulence
Here turbulence has occurred due to competition from a successful product as success always attracts competition.
4) Market Saturation
Here sales are high and good and most firms feel that they are doing well but in fact they are at risk.
5) Market Decline
With Market saturation a plateau has been reached but this indicates that market decline is near. It is possible to develop substitute products at this stage but the failure rate is great.
6) Zero Sales
Here the only solution is for the receiver to salvage what can be saved.
DIAGRAM 2 - PRODUCT CYCLES
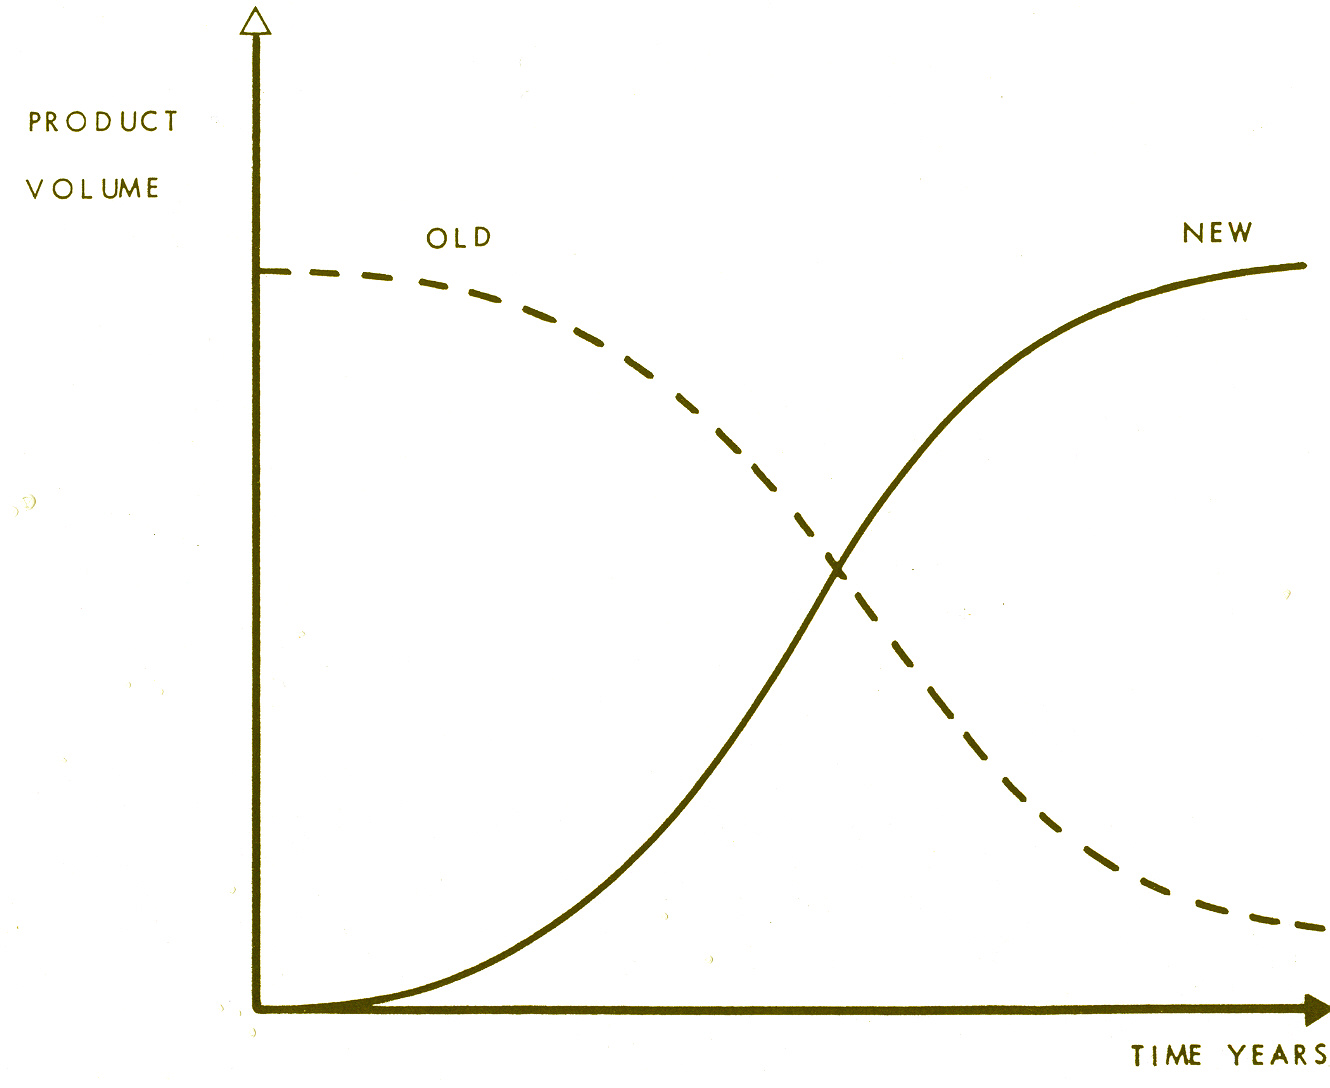
Product Substitution
Market decline phase is generally accompanied by a Substitution Process somewhere. That is to say a new product or technology is taking over the demand in the Market which has reached Saturation and this new product/technology has its own S curve - while also causing a Substitution Curve in the Saturated Market. Substitution Curves tend to be the reverse of S curves. Old products tend to fight back when subjected to substitution - and is an important input to the shape of the new product's S curve.
Watching for the emergence of Substituting Products is an important input for forecasting the shape of an S curve in the Saturation or Decline Phases.
As it has been shown product life cycles can be extended by better design and improved production methods but for many products the life cycle is shortening. Therefore research on product substitution needs to be done soon after the launch of a new product or even at the same time. Also it is essential to plot the growth of more than one product so that when the turbulent phase is reached then more resources can be allocated for new developments. This can be linked to envelope curves in this area which helps to develop a wider view.
DIAGRAM 3 - SUBSTITUTION PROCESSES
Conclusion
Product Life Cycle Analysis should be more widely used if an organisation is to maintain its competitive edge over other organisations. Firms need a policy of continuous improvement of products whenever possible. This linked to good quality control explains much of the success of Japanese industry. However there must always be some resources allocated to product substitution. Therefore this is the phase to which more resources should be allocated at the Market Turbulance Phase for both marginal improvements of products and the development of new products. Unless this is done at this stage business decline may not be halted. See also Surveillance for properties of industries in various phases of the Life Cycle.
Brian Burrows Futures Information Associates 18/10/93
MODELLING
Creating a representation of a business function, which can then be used for simulation and forecasting.
Description
Many Marketeers have found relationships between price and product demand. Thus if price is raised by X% and sales fall by Y%, the relationship between X and Y may be expressed in the form of a graph, gained from results of test marketing, or price changes. Such a graph will be a model of the price-demand for that product. Often attempts are made to express the relation between X and Y in the form of a mathematical equation - in which case the equation is the model.
Business games, sometimes played on management courses, construct such models. They generally also embody a crude measure of quality - so that the higher quality product will sell more at a given price than a lower quality. This produces a series of graphs - one for each quality - sometimes called Nonograms. The quality relationship may be expressible as an equation, and a way found to combining it with the price-demand equation.
In business games there are generally 2 other quantities
•
the respective advertising of each product in the market - the more a product is advertised the more sales it will achieve - up to some saturation limit.•
the business game has to calculate a total market demand from the competing products on offer and their respective price, qualities and advertising, and then apportion sales to each.The resulting business game is quite a complicated model of a market. The 4 qualities discussed above can each be represented by graphs, and rules made of how to combine them. They may each be expressible as equations, and mathematical means used to arrive at the sales of each product.
Constructing such a model of a firm's own market can cause one to learn a great deal about how your market works. One needs to start from the total demand in the market - the growth of which can generally be related to the growth of GNP, or one of its economic components such as Consumer Expenditure - but there is often a lag. That is, ones market may be found to grow at M times GNP, but the maximum growth being L months after the maximum GNP growth. The factors M and L have to be identified by studying economic and industry data. Where M is high, say 5, the market is likely to be very cyclic with the Business Cycle - as it often seems the M factor goes on applying if the economy is contracting - turning the market into high contraction. This type of problem has immense strategic implications - but it is surprising how many firms have not identified this simple relationship.
Fitting the rest of the model together proceeds like constructing a business game discussed above. The relationships have to come from the firm's experience in market moves - and cannot be exact. Quite a lot of the graphs will have to be guessed, and thus subject to uncertainty - which can however be estimated.
Once you have your market model you can feed into it the economic assumptions, and the firm's intended market moves, and it will output a sales forecast. Possible moves by competitors can be inputted - giving a range of sales. If the firm is planning a major market move, then reactions by competitors can be studied, and their effect.
Other topics can be modelled as in this example - such as key supplies - though these will again include markets, but from the purchaser's point of view.
Applications
Modelling markets and supplier's markets are fairly common among large firms. Other applications occur, especially in finance, which will be dealt with under Computer Models.
Production processes are modelled, a necessary trend with increasing automation. Forecasting stock levels may become more accurate, enabling reductions in stock holding.
Limitations and Evaluation
The main problem with models is that the relationships which are identified may alter in the period ahead when the model is used for forecasting.
Such alterations can be used to advantage. The factor M discussed above may be reasonably stable in the short term, but can be expected to change in sympathy with the Product Cycle (q.v.). The trend in M over several Business Cycles is an input in understanding the Product Cycle. Naturally, any forecast from the Product Cycle work will be fed into the market model, M being revised.
Other changes in the models which have been put together may be more difficult to spot, such as price-demand relationships. This is the ultimate limitation of modelling. There may be temptation to model finer and finer detail - but there will always come a point at which details change faster than you can identify and model them. As will discussed under economic models, economic growth will be subject to quite wide uncertainty, and as demand in most markets is linked to economic growth, there is bound to be a significant uncertainty envelope around any sales forecast. There is little point modelling detail much finer than the uncertainty envelope. Modelling will be time consuming, and therefore expensive, and should not be taken into greater detail than justified by the identified uncertainties.
Cases
Derek Done, a long standing member of the study group, gave presentations to the Study Group and the Seminar in June 1990. He gave an example of the approach to Air Travel Demand Forecasting, reproduced in the following panels 5 - 12.
PANEL 5: MODELLING
EXAMPLE: AIR TRAVEL DEMAND FORECASTING
Different methods used:
PANEL 6: MODELLING
EXAMPLE: AIR TRAVEL DEMAND FORECASTING
Approach to ecconometric forecasting basically common sense:
PANEL 7: MODELLING
EXAMPLE: AIR TRAVEL DEMAND FORECASTING
STAGE 1 -
Determine model structure
INDEX of TRAFIC GROWTH =
(INDEX OF GDP CHANGE) to the power a TIMES (INDEX OF PRICE CHANGE) to the power b
PANEL 8: MODELLING
EXAMPLE: AIR TRAVEL DEMAND FORECASTING
Stage 2 -
Estimate the parameters
EXPRESSED AS A FORMULA
INDEX of TRAFFIC GROWTH =
(INDEX of GDP CHANGE) cubed TIMES square root of (INDEX OF PRICE CHANGE)
PANEL 9: MODELLING
EXAMPLE: AIR TRAVEL DEMAND FORECASTING
STAGE 3 -
Make the forecast
EXPRESSED AS A FORMULA
INDEX OF TRAFFIC GROWTH =
(1.03)cubed TIMES square root of (.97) =
1.161 =
RATE OF GROWTH = + 16.1%
PANEL 10: MODELLING
EXAMPLE: AIR TRAVEL DEMAND FORECASTING
EVALUATE THE RESULTS
What are the critical assumptions?
PANEL11: MODELLING
PROBLEMS WITH ECONOMETRIC FORCASTING MODELS
4 different measures of GDP
balancing item in balance of payments sometimes larger than trade deficit
may be more difficult to predict than what is to be forecast
PANEL 12: MODELLING
WHY FORECAST ANYWAY?
TWO VIEWS
Requires greater accuracy of input assumptions
Models can meet this need, even if forecasts cannot be improved
COMPUTER MODELS
When a model is contained in a Computer Programme it may be called a Computer Model.
Description
In the last section it was suggested that as well as forming the models as graphs, it may be possible to express the relationships as mathematical formulae, and to arrange for the interactions between the formulae to be undertaken mathematically. If these are done, the whole process lends itself to being calculated on a computer, and may be called a computer model.
In the example of modelling markets given under Models it may well not be the case that the equations derived to represent the models are fundamental mathematical equations - but are empirical formulae found by mathematicians or statisticians to represent sufficiently approximately the relationships which have been found or assumed, say between price and demand.
Application
Most models nowadays tend to be complete models.
Other parts of the corporation other than markets can be modelled. Financial modelling is common. This results in much of the accounting function being automated. For Forecasting, it means the consequences of different corporate strategies can be run through into future years in detail into proforma Profit-Loss accounts, and Balance Sheets quite quickly.
Limitations and Evaluations
While most models are now Computer Models, the Study Group had considerable reservations about their use as Forecasting Methods. If they are merely used as calculating machines that is fine - but increasingly they are used by people who do not understand how the computer model works, and this can be dangerous. In the modern Corporate Culture things coming from computers take on a status that they would not have if they had been generated from other means. This is one of the dangers: just because a forecast has come from a computer does not mean it will be right.
To go back to the example of the business game that we started our discussion on models. Early business games were run manually from a series of graphs. It is a fair bet that the organisers of such games had a fair idea how the model worked. The later generation of management trainers who merely fed numbers into a computer model which they rented would have far less understanding of how the model worked. In the use of models for forecasting we discussed the problem that relationships in the real world change with time - the forecaster has to identify these changes, and to anticipate them in assessing uncertainty. Can he do that if he does not understand what the computer is doing? I cannot see how he can. The user of the forecast also needs a reasonable idea of how the forecast arose. A set of graphs may be more intelligible - as in our business game example. If you are not very clear what a computer model is doing, you may be better off constructing a graphical manual model, or other representation that you understand.
There is no reason why you cannot have the computer boys turn your manual model into a computer one - and thus reap the benefits of rapid calculation of a large number of alternatives. The manual model will be your main model, the one you amend when necessary as described previously. The computer model is then being used as a calculating device, and of course amended accordingly when you amend your manual model.
The Study Group had further criticisms of computer models in that the state of the art was still too geared to the output of discreet forecasts, and not enough towards Uncertainty Envelopes. It was admitted that users of forecasts wanted certainty - hence a tendency to single number or single line forecast. While users may want certainty, in general they will not get to it - most single line forecasts will be wrong. As discussed under Trend Extrapolation, the output of a forecast should incorporate the best measure of the uncertainty possible. Pandering to users' desire for certainty will only result in discrediting the forecasting process.
The computer does aid the generation of Uncertainty Envelopes, because of its ability to quickly calculate a lot of alternatives. Thus, instead of just running the model with what is regarded as the most likely value of each variable, run the model with the likely variation of each variable, plus arrange to run the model so it shows the effect of the uncertainties in the model itself. You need to consult a statistician on how to combine probabilities - for running the worst case for each variable will have a lower probability of occurring than the probability you assign to the worst case of one variable. You can be certain however the computer model will now output a range of forecasts, and since your uncertainties will all increase as you go forward in time, so will the range of forecasts it outputs.
SYSTEMS ANALYSIS
Modelling a situation where all the interactions are known.
Description
In discussing modelling so far we have cautioned against going into too much detail - as it will eventually be found in branches of the social sciences that the details change faster than you can model them. Thus most business models are simplified representations of the world they represent, and subject to Uncertainty because of the simplicity and from the changes that are continually occurring. This is in contrast to the hard physical sciences where relationships are constant and even if a model is simplified it will be repeatable over time subject only to certain statistical fluctuations.
There may be a few occasions when a problem you wish to model is more in line with the latter than the former use. A production process based on chemistry and physics may thus be modelled, and forecast made of optimum designs of the process from running a lot of variations.
If you are sure that you know all or most of the variables, and understand exactly or fairly accurately the relationship between all the variables, then the principles of System Analysis can be employed to construct an all-embracing model. The Computer Industry employs System Analysis to translate problems into Computer Programmes and Software, and help from System Analysists should be sought.
Applications
Few cases were known among the Study Group of applications of System Analysis for business forecasting purposes. There is an International Institute of Systems Analysis in Switzerland.
INPUT - OUTPUT MODELS
Where a process gives its output as input to a number of other processes, Input - Output Models may be useful.
Description
National industry statistics are compiled showing how the outputs of one industry form inputs to other industries.
Studies of these interdependencies, and their changes over time can help one to understand some of the forces operating in one's own industry. If these are modelled, together with demand trends in the other industries it can lead to a demand forecast in one's own industry - since the demand for the output of one industry can be derived from estimates of the likely demand for the other industries if the analysis is complete enough.
This is particularly true for industries which produce intermediate industrial products such as steel.
Application
It was thought by the Study Group that this approach should be useful to help understand relationships between markets, but it was not greatly used. Possibly it was used more in the USA. One member had used the UK Input - Output statistics on occasions. There was problems of the soundness of the data, which will be dealt with under Economic Models.
Limitations and Evaluation
The main problem with a model as given under Description is that you may have to model the whole economy, or a large part of it - a problem to be discussed under Economic Models.
Where a market or industrial sector serves a limited number of other industrial sectors this approach may be more fruitful. It may then be worth the time understanding the fortunes of those sectors, and modelling the relationships with one's own.
PANEL 13: INPUT OUTPUT ANALYSIS
"....seeks to take account of the interdependence of the production plans and activities of the many industries which constitute an economy. This interdependence arises out of the fact that each industry employs the outputs of other industries as its raw materials...."
CORRELATIONS AND REGRESSION ANALYSIS
Identifying when a change in one variable accompanies a change in another variable.
Description
In the example under models, where there often is an effect observable in markets of the growth in the economy, a statistical technique know as Correlation can tell you if the effect in your data is just chance. If the effect is just chance then most likely it will not occur again - it was just coincidence. If however the probability given by the Correlation is small, it means that it is likely that there is a real connection between the growth of one's market and the growth in the economy. The Correlation in fact gives the probability that the data (here your market and the economy) arranged itself in that way by chance. Statisticians set a threshold, in fact quite low, that probabilities down to 1/20 are just chance. Probabilities lower than 1/20 are taken as indicating something non-chance is occurring. However, if in fact chance only is operating, then on average 1 in 20 of such observations will still give on such Correlation Analysis a probability of 1/20. The probability which comes out of such a Correlation Analysis is really a false alarm rate. Thus if one is going to take serious decisions on a relationship of your market and the economy this probability should be smaller - maybe 1/100 or 1/1000. Statisticians say if a significance test (such as Correlation) yields a probability less than 1/20 then it is significant, and the significance increases the smaller this probability.
The more data you have, the smaller this probability will be, if there is a real connection between your market and the economy. A statistician should be consulted in how to undertake the Correlation Analysis. Fisher (1925-70) gives an account of the method, as do most other statistical text books. PC's have Correlation packages.
While one tries to find by Correlations when one thing affects another, the output from a Correlation only gives the chance probability of the data arranging itself that way, it does not tell you what is affecting what. You might assume that it is the growth in the economy which is making your market grow - but that is your assumption, it does not come from the statistics. A lot of mistakes have been made with Correlations in wrongly assuming the direction of cause and effect. As will be seen under Economic Models, the economy - market problem is not necessarily so straightforward: economists cannot really say by how much the economy will grow or why - in their models economic growth is the sum of all the individual market growths - which possibly means that cause and effect is running in the opposite direction than we assumed two sentences above! Remember also that a Correlation does not prove that the two quantities Correlated are affecting each other - both may be affected by a third quantity which you haven't thought of. Many mistakes have been attributed to this.
With these pitfalls in mind, Correlation methods are able to indicate quantities which are related to each other. If you have enough data, Correlations can show meaningful connections not apparent from inspection of the data itself, because of random noise and/or too many things going on at once.
Derek Done, in his presentation to the June 1990 Study Group Seminar, suggested a framework for searching for Correlated relationships. The starting point is economic theory - what factors does economic theory suggest influence your market. Then you can search the data for each of such factors, and see if what comes out of the Correlations. There may be factors other than from economic theory - but you can only find them from hunch, luck or creativity. See Derek Done's Panel no.7.
Regression Analysis is part of the Correlation technique. In the example of the economy affecting a market where
Market Growth = M x (Economic Growth) - C
Regression Analysis can tell you if the factor M is just chance or is unlikely to be chance - i.e. significant. It can calculate the value of M, and indicate if it is linear- that is constant for all observed values of economic growth, or whether M changes with different values of economic growth.
It may become apparent from such an analysis that a better relationship for the growth of one's market is M x Economic Growth - C, where C is a contraction constant (the lag L being applied if it exists). The existence of C is expected from economic theory: a driving force in Western economies is the continual increase in efficiency of the use of nearly everything. Thus if there is zero economic growth, people may well use less of your product due to this efficiency factor - and C can be identified (when L is allowed for). If M falls away as the downward decline part of the S curve occurs, you may be left with the dread prospect of the -C factor dominating the market.
For major markets, such as a commodity, M, L, and C can be found from inspection of the data without use of Correlations. However, Correlation and Regression analysis can give more detail and their significances. Different parts of the data can be taken to see if M and C vary over time. L may be calculated directly in some software packages - if not vary L until M is a maximum - giving the best estimates for both.
In principle, other factors discovered by Correlation can be dealt with in the same way, and more detail learnt about them.
When this has been done these factors can be added to the market model in a similar way to the effect of the economy on the market. Only factors found to be significant from Correlation or Regression Analysis should be included. The factors we have identified from statistical analysis, such as M, are added to our market model. We need a means however of forecasting what these factors will do in the future. It may be that some appear to have been stable for a long time in the past - in which case they might be assumed to be constant in the future. Regression Analysis over successive periods may show a factor has a secular change - leading to making a forecast of that factor - using any of the forecasting methods as appropriate. One might even build a model of it. If that model shares common inputs to your market model the two may be built into each other. The warning given previously of how far you go in modelling should be considered. You have the same problem with forecasting economic growth which may be the single largest factor influencing market demand. You cannot model the whole economy - and the problem will be taken up under Economic Models.
Derek Done in his presentations gave some illustrative suggestions of what may be ment by models given in his Panels 1 - 4. Our simple market model we started with was primarily based on economic relationships, and this might be called an economic model. We soon turned it also into a computer model. In this section we have also turned it into a statistical model, and as this is dealing with a model based on economic theory it is also now an econometric model.
PANEL 1: MODELLING
WHAT IS A FORECASTING MODEL?
PANEL 2: MODELLING
A FORECASTING MODEL IS NORMALLY:
PANEL 3: MODELLING
WHAT ARE ECONOMIC RELATIONSHIPS?
Can be simple
But many simple relationships may be related to each other in a complex way
PANEL 4: MODELLING
Application
Most members of the Study Group who had participated in these modelling sessions had used market models, some had used micro-models with some of the above features for an individual industry or firm, but they were not widespread. Relating macro-models to micro-models did not seem to occur - no company representative had related growth in their markets to that of the economy as a whole. Consultants present had done such work for clients - econometric modelling of the economy's relation to a market may be confined to large firms with large shares of national markets.
Some types of businesses had more needs than others for this type of information. Retail outlets may be able to react to short term demand without much reliance on forecasting - though longer term problems of store capacity, size and location might be helped by models. Equipment manufacturers may have needs as their sales tended to be more affected by current economic conditions.
Models can be a good way of testing assumptions and answering "what if" questions. Scope was seen where speed of response to a changing environment was important, where models can explore different possibilities - and indicate if and when a particular change may have a significant impact.
The identification of a Correlation should trigger the search for the cause, which may lead to understanding which direction the cause runs. The cause may lead to a greater understanding of the market and how to meet any market opportunity involved. The cause as described in words is also a model - and may well be a Socio-Demographic Model, see Panel 4. Correlations with time of year or annual events are often recognised in firm's markets.
Limitations and Assessment
The limitations of using Correlated relationships in models follows the limitations already cited for models - that relationships can change - and should be met by an Uncertainty estimate.
An example cited was the effect of inflation on savings. It can be seen clearly from past data that savings rise with inflation, which has been good news for savings institutions in modern times. The reason is that people try and maintain the real value of their savings - and thus try and save more of their income in an inflationary environment. An econometric model of this can be constructed. Unfortunately, the model breaks down at some point - for the simple reason that if inflation goes too high it becomes impossible for people to save enough. The record of history in several epochs is that people switch to saving in goods - and there is a flight out of paper (or unsound) money - which is bad news for savings institutions. The lesson from this is if conditions go outside those on which the model is based, the model cannot be relied upon or must have wider and wider uncertainties assigned to it. Thus an inflation - savings model based on 1950-60's data ceased to work in the 1970's hyper inflation in the UK and the US.
Data for large national markets and industrial sections may be readily available - but data for individual markets may be more difficult to obtain. Many firms' own data bases are often inadequate. Data is required for all the factors you wish to Correlate with each other. Unlike Trend Extrapolation where gaps in the data can be handled, this method needs more continuous sets of data for the factors. Two factors being correlated must have data available for the same time periods.
Data is gathered by most of the advanced economies on a wide range of social demographic factors. Some of these may be fruitful sources of Correlations with specific markets, such as the changes and spending powers of particular classes of persons.
Cases
A number of cases have been used to build up a description of this method and its limitations. A large use at present is fund management, where dealings in stock and commodity markets for many funds is automated and controlled by econometric models. These are causing problems in these markets with too many "buy" or "sell" orders being generated at once in one direction for one stock. Positive feedback may then occur - say the depressed price from the "sell" orders generates more computer order sales. This occurs with entirely human controlled fund managements, but appears to be worse with the largely computer controlled ones. Studies have shown that most fund managers perform no better than if one had picked the stocks at random - and even those that do, few do so over long periods of time. It will be interesting to see if econometric models alter this.
References
Derek Done Modelling, Business Environment Group Seminar,
Strategic Planning Society, 11th June 1990
Sir Ronald Fisher Statistical Methods for Research Workers
Oliver and Boyd 1925 - 70 Sec. 30
ECONOMIC MODELS OF A COUNTRY
Description
We discussed forming an econometric model of a market, and suggested a case may occur where two models of different markets may be run together, one inputting into the other. If one imagines extending the process to all the markets in the economy, and adding the large effect of government, you will have some idea of how a model of the whole economy might be constructed.
In fact, the present state of the art is a lot more simple than this. No one has attempted to model and bring together all the markets in the economy. At best, attention is confined to the major industrial and commercial sectors - perhaps a few dozen.
When the writer studied this area in the late 1960's, the models of the economy had to have an economic growth rate fed into them. The model then divided the cake up among the industrial and other sectors according to past observed relationships, as we have discussed, and you could then see how the various sectors performed as the simulated years went by. The models did not forecast a country's economic growth rate - the quantity one might be expected to need a forecast of. We were told to try 3% GNP growth, and 4%, the actual might reasonably be hoped to be somewhere between these two growth rates. One then has to wait and see what the actual growth rates were.
Over the years such economic models have come before the Study Group, especially the Treasury model. A large number of assumptions had to be fed into it for it to work - drawing the comment that these were just the sort of factors that one needed forecasts about. If the economic models were not going to provide forecasts, then one has to provide forecasts by other means - it did not seem that these economic models had much direct relevance to forecasting.
It did not seem that economists had clear ideas of what caused economic growth, which led the writer and the Study Group to consider the matter themselves (Whaley, 1979, 1988). This led us into largely social factors, upon which we conducted a Delphi exercise on International Growth Rates.
Another problem with economists is that there is not consensus among them that the economy goes in cycles. Certainly Economic Cycles of four to five years can be traced back to the Industrial Revolution, in Chinese Medieval data, and are mentioned by Roman Historians (but without period of cycles being mentioned). Members of the Study Group have commented on occasions in relation to models of the economy that there are so many feedback loops that the principles of Control Theory should apply. Feedback loops and Control Theory provide that there will be oscillations. It is impossible to make a central heating system in which the temperature does not oscillate around the thermostat setting.
It is not known if any economic model of the economy has been made in a Cyclic output. If not, it is very possible that those models are poor representations of reality.
Bridget Rosewell, Managing Director of Business Strategies, gave a presentation to the Study Group, as part of our Forecasting study, in 1988 on Econometrics and Forecasting. It seemed that the state of the art had not much advanced from our earlier views of it. She considered that models are useful for:
- determining consistency in assumptions
- answering "what-if" questions, such as the effect of different levels of
advertising on sales, and testing different possibilities.
Forecasting basic things like the economic growth rate for a country do not appear yet to be part of their capability.
This leaves the business in a severe need of a means of making some economic forecasts, for as we have seen the level of economic growth may be the largest single factor altering the market demand over the next few years.
There is a puzzle, as economic forecasts from owners of large economic models covering national economies are regularly published in the press. We are led to believe that the large impressive models generate these forecasts. From the above discussion there is doubt that this is so, but we are left uncertain how these forecasts of economic growth are produced, and what part these models play in them.
Business can try taking the average of such published forecasts, and fix an Uncertainty by how much the actual out-turn departs from such an average forecast in the past. You are likely to find the Uncertainty will be comparable with the magnitude of the forecast (in which case a random number generator might be just as good as the forecasts). These forecasts have been particularly prone at not flagging the onset of recession. See Using Published Forecasts in this volume.
Business may try and improve on this by making their own little model. If you believe in Economic and Business Cycles then the past record has been about a year of growth, followed by about a year of fall-off, then about a year of recession (which may show some contraction, especially in individual markets), then about a year of recovery. Some of these four phases may go on for longer, giving a typical four to five year Cycle. If therefore there has been a year of well above average growth, the chances begin to mount that a fall-of will follow, and one's Uncertainty Envelope adjusted accordingly. In other parts of the Cycle you may be confident that the current trend will continue for a certain time. You may use indicators from economic theory, depending on your knowledge and time considered worth devoting. One can try mapping out the Cycle for four years ahead - but in the writer's experience tends to get out of phase with actual after a couple of years as the periodicity is variable - though this can be allowed for with an Uncertainty Envelope.
This exercise tends to show for many markets that the Uncertainty in demand more than a year ahead can be quite high - but this Uncertainty is nevertheless quantifiable.
Applications
Large economic models of the UK economy are maintained by the Treasury, several Universities, and Consultancies. The Study Group did not think it would be necessary for a company to build its own having regard to restricted applications which the current state of the art of country economic models provide - and time can be rented on existing ones.
Similar models are available in other major countries.
Limitations and Evaluation
The limitations of economy-wide models have been discussed under Description, where abilities are commonly ascribed to them which are not present in the current state of the art.
Bridget Rosewell indicated problems. The actual world may change as the models are made. We have already mentioned this problem. Several members of the Study Group had independently come to the conclusion that there may be an Uncertainty Principle of Economics - as a parallel concept to the Uncertainty Principle in Physics. It seems economists could explain what had happened after the event, but seldom at the time or in advance. That the phase of an Economic Cycle must dissolve into Uncertainty a short way ahead, and in the writer's experience it is difficult to know where you are in the Cycle at a given time, have some parallels with the Physical Principle. There is a strong possibility that Economy-wide models fall into the trap already mentioned - that they are so big and complicated that the world changes too much while they are being built for them to be a reasonable representation of reality.
A reason it is difficult to work out precisely where you currently are in the Economic Cycle is that much of the data takes so long to come out. Bridget Rosewell pointed to severe problems with the data. Although governments collect and publish large amounts, the current publication of a given figure should be taken as a forecast, not a firm figure. It will be found that a particular figure will alter in successive publication of it, and can take several years or longer to settle down. Government does not even have an accurate figure on what it has spent month by month. The great depression of the 1930's looks far milder in modern data on it. An Uncertainty Envelope can be estimated for a figure by seeing how much it tends to vary before it settles down - and how long this takes. The Uncertainty may not be symmetrical. Bridget Rosewell pointed to the inaccuracies of Balance of Payments. The great recessions of 1950's - 1970's were largely triggered by the government's reactions to the apparently huge Balance of Payments deficits. But these deficits are hardly apparent in modern data. There was a systematic under recording of Exports at the time. This probably comes from the fact that Customs duty is generally paid on imports so are recorded in detail at the time - any that evaded duty will however be kept dark subsequently. Exports do not attract Custom's duty, so their details may come in from various sources over time. It's not explained why this may take decades. Since there is an evaded item on the Import side, the settled-down figures may not in fact be as accurate or rosy as they appear. This is part of a problem that the Study Group has considered in the past - the data available and models on it refer to the formal economy. Evasion of Government imposts is not confined to Customs Duties, and leads to a growing informal or underground economy - where by definition there is no data so it cannot be modelled - but where much of the action may be. This is a further limitation on use of economy-wide models.
Their use in business forecasting is likely to be small, though some use is made of rented time on the large models.
References
Richard Whaley International Growth Rates in Business Environment
over the next two Decades
Society for Long Range Planning 1979 P4
Richard Whaley (Ed) Business Futures Strategic Planning Society 1988 P4
Richard Whaley September 1994
SCENARIO WRITING
The technique of writing an account or picture of the present position and future development of the area under consideration. In order to generate the forecast element other forecasting methods must be used - the combination often being called Scenario Planning.
Description
The method of writing a picture of future developments enables the interaction of future events with the organisation to be seen, so strategy and other planning functions can be carried out. There should be emphasis on the external view, of markets and consumers, and the organisations long term place in the market.
Very often separate scenarios are written for different parts of the area for which scenarios are needed. Ways are incorporated to indicate possible alternatives to the future developments, with assessments of the likelihood of each alternative occurring. The Study Group considered it was dangerous to write three scenarios incorporating the optimistic, pessimistic, and most likely Scenario - the tendency was too strong to pick the middle 'most likely' scenario. However, building in alternatives was a way of constructing an Uncertainty Envelope, with qualifications.
Scenario Planning was originally developed by Herman Kahn at the Rand Corporation in the 1950's, and later at his own Hudson Institute. It was adopted by General Electric, Shell, OECD, and by consultants Battelle, Inter Matrix and others.
Applications
The method, as scenario planning, has wide use in business. The performance of the firm or organisation can be assessed from a set of scenarios. Opportunities, threats can be identified, and strategies developed. The alternatives identified lead to contingency plans, and the less profitable investigated further or dropped depending on the impact they have.
Limitations
The method does not itself produce forecasts, and much of the input to the Study Group concerned how different organisations use various other methods to construct scenarios.
Presentations were given by James Thring of Battelle, and Study Group member Geoffrey Morris of Inter Matrix. Methods cited as being used to generate forecasts were Delphi, Cross Impact Analysis, Trend Extrapolation, Simulation, Modelling, Scenario Trees, Games, Historical Analysis, Normative Methods, Surveys, Brain Storming and Intuition. In fact most of the methods studied by the Group feature. It was not possible to ascertain exactly how these consultants used these methods in concert, and no doubt much depends on their experience and ingenuity. Some guidelines were given. Inter Matrix in particular concentrates on producing a comprehensive and robust picture of the business environment relevant to the firm or study:
- establish links between different forces and the objectives of the firm -
'Driving Force Scenario' - elements and issues should be studied.
- a consistent set of values for the external environment was essential.
- focus on end objectives, and decide where you want to get to.
- Systems Change Scenario - explore inter-relation of people and the scenarios.
- Slice of Time Scenario - snap shot at a particular point in time can be given -
say in headline form.
- Limit the number of alternatives given - but include sufficient for the
particular business, with important priorities and issues covered, and the key
action.
- wide view of the world essential - consultants can be superior to in-house
generation.
Cases
It was agreed that the external view was often neglected in in-house work in firms, who concentrate too much on internal organisation and their product applications.
Scenario Writing and Planning is not so much a forecasting method, but more of a self-contained forecasting and planning system. The various forecasting methods are used to build as a comprehensive view as possible of the external and internal environment of the firm. The forecasts are portrayed as Scenarios. Scenarios are then used in the planning process of the firm.
Further Information
Geoffery Morris - Presentation - Business Environment Group Seminar - Forecasting 11th June 1990 - The Strategic Planning Society
Richard Whaley September 1993
DELPHI AND PANEL METHODS
Purpose
The purpose of these methods is normally to obtain robust views on uncertain matters, typically conditions or events some considerable time ahead, or to simulate likely reactions by competitors or others to actions by the organisation..
Description
In the classic Delphi method a panel of experts with different backgrounds (not just technical) is asked to give their views in response to a questionnaire. Typically the questions might cover probability of certain events or their likely time scale. The results of this round are fed back to the panel who are asked to reconsider their opinions in the light of the overall replies. This second round of responses is analysed to present either a single, or alternative answers, to the questions.
However panels can be used for almost any forecasting where definitive models are not available. A variety of expertise is desirable and the final assessments should be made after a free discussion or at least a second round of opinions.
An interesting extension of these methods is "war games" where individuals play roles such as the competitor's marketing director or the industry regulator and various strategies by the company are staged.
Applications
Typical applications include:-
timing of future technological events
future technological trends
international competitiveness
product strategy
take-over battles
Evaluations
These methods are basically for use when other more formal methods are not applicable and no trustworthy expert opinion is available.
As in market research, the value of such exercises depends critically on the exact choice and wording of the questionnaire or scenario. Preliminary discussion of this should be as widespread as convenient.
The methods clearly have a value as a consensus view rather than just representing the view of one, generally biased, individual.
However although there are many references to Delphi techniques in literature, it does not appear that they are widely employed. They are time-consuming. Experts enrolled in a Delphi study tend to be optimistic on timing and costs. In general it seems that they do not lead to much accuracy in their predictions.
Role playing panels are not so well documented but we do know of their satisfactory use in take-over situations.
Cases
The Futures Group carried out a Delphi Study on international competitiveness back in 1978. Some predictions were reasonably accurate but others were not.
The Study Group reviewed the outputs of Delphi Studies, and concluded that most of the publicly available material was old - from around the time the method was developed. These studies tended to be optimistic - with things forecast to happen faster than they actually did. If the method has been used subsequently the results have been kept confidential.
Further Information
The original description of the Delphi method was given by Mr. Helmer of the Rand Corporation in the mid-1960s. There has been surprisingly little literature since then.
There was an article on the topic in the Long Range Planning Journal Volume 17, Number 4, page 73 (August 1984).
Author
Donald Alexander - 13 December 1993
CREATIVE METHODS
MORPHOLOGICAL RESEARCH
This is a technological forecasting technique. The components of a technology or device are broken up into its basic components, and re-assembled in different ways - in order to see what technological developments may arise from it.
Description
The method is attributed to F Zwicky at Jet Laboratories in early 1960's. A Society for Morphological Research was founded in Pasadena, California. The Study Group considered the methodology was similar to analysing a firm for its strengths, weaknesses, opportunities and threats. Here the attempt is to dissect the firm into salient components, and put it back together again as a more stronger and opportunity seeking entity.
It is essentially a creative process. Cross Impact Analysis (q.v.) plays an essential part in seeing what new uses and interfaces can be made out of the existing components.
Applications
Essentially the method is for searching for and predicting new technological inventions. Not in widespread use - except its methodology is in more widespread use in Strategic Planning.
Limitations and Evaluations
Applicable only to technology and systems already in existence, and requires extensive knowledge of them.
Cases
Used by Zwicky to study alternative uses for jet engines, and how its component parts inter-related. It produced 3600 possibilities. Some versions created novel devices which used the external intake as fuel. As such, an upper atmosphere ram jet may be practical which uses the ionised air as fuel.
Peter Brown, whose firm did work on the heat resisting tiles for the US Space Shuttle, used such an approach to see what other uses could be made of the technology.
Further Information
Society for Morphological, Pasadena, California, USA.
Richard Whaley November 1993.
CROSS-IMPACT ANALYSIS
Purpose
An analytical technique for identifying the various impacts of specific trends or events, or well defined policy actions, on other trends or events. It explores whether the occurrence of one event or implementation of one policy is likely to inhibit, enhance, or have no effect on the occurrence of another.
Description
Cross-impact analysis assesses the consequence, or scale of change, that is likely to occur when identified trends and events are contrasted against each other. The technique evaluates the interactive impact of these changes upon business. It is this interaction that develops new ideas and opportunities (to develop new products) and it is this aspect that is the basis for innovation.
It is necessary to identify those things on which you wish to explore the impacts amoung themselves - or among other things. Then you take each thing one at a time - and consider how it will affect each of the other things taken one at a time. There are no rules for evaluating the effect of each such impact - common sense, or a separate detailed analysis maybe necessary.
If there are a large number of things to impact with each other the analysis can take a long time - but produces conclusions which could not be obtained by other means.
Applications
Environmental forecasting systems to determine the impacts of changes in macro-economics: political, economic, technological and social arenas; and also in microeconomics: industry structure, regulation, competition, customer needs etc. However, the technique may be applied to wholly internal change or any combination of the above. (A number of techniques may be applied to support outcome forecasts e.g. market research, Delphi groups.)
Cross-impact analysis may be enhanced through role play. Key actors are identified and allocated influence budgets; individuals then cut out key issues and `spend` their budget on chosen variables. This helps clarify the actions and reactions of these important players.
Evaluations and Limitations
Cross-impact analysis provides a structured methodology to identify and discuss relevant issues. Many new consequences can arise from an organised approach to the understanding of impacts from two or more elements, in a way that may not previously, have been perceived.
The principle difficulty is in determining the key variables that should be analysed and forecast. Failure to prioritise may lead to too many cross-impacts. (Solutions include prioritisation and clustering the elements into small numbers of related concepts groups.) As with all techniques the quality and spectrum of the participants has a great influence upon the nature of the outcome.
Cases
Arthur Koestler has developed the concept of bisociation in his book "The Act of Creation". An example he gives is the combination of the block and the wine press which created the printing press. A current example of the opportunities that may be explored lies in the realm of technology convergence where the combination of computing, telephony, information services and entertainment holds the potential to shift services towards a networked economy.
Further Information
There are many books dealing with strategic planning: modelling and analytical techniques. The following list identifies some relevant papers:
1 Duval et al, Cross-impact analysis: a handbook on concepts and applications, in M. M. Baldwin (Ed.), Portraits of Complexity. Applications of Systems Methodologies to Societal Problems, Battelle Memorial Institute, Columbus, Ohio, pp. 202-222 (1975);
2 T. J. Gordon and H. Hayward, Initial experiments with the Cross Impact Matrix method for forecasting, Futures, 1, 100-116, December (1968);
3 Selwyn Enzer, Delphi and Cross-impact Analysis; an effective combination for systematic futures analysis, Futures, 3, 48-61, March 1971;
4 Olaf Helmer, Reassessment of Cross-impact Analysis, Futures, 13, 389-400, October 1981;
5 William R. Huss and Edward J. Honton, Scenario planning - what style should you use?, Long Range Planning, Vol. 20, No. 4, 21-29, 1987.
Author
William Rann - Friday, November 26, 1993
USING PUBLISHED FORECASTS
Purpose
The purpose of using published forecasts, particularly for economic and environmental factors, is to obtain information that will enable the organisation to run better; but to do so in a more cost effective way than commissioning custom or syndicated research and/or to obtain a consensus view rather than a potentially maverick view that might be obtained from a small in-house team.
Description
A number, say five or more, of published forecasts covering similar topics are compared. An average might be taken of the individual predictions for such factors as the growth in GDP or other use made such as accepting the "envelope" represented by the extreme predictions for each variable.
There are many sources of published forecasts. For macro-economic data two good sources are the monthly Treasury's "Forecasts for the UK Economy" and the six-monthly table in the Financial Times. Both give 11 independent forecasts, from such sources as the National Institute for Economic and Social Research, and 11 City forecasts from such companies as County Natwest. In addition the Treasury's own forecasts are given. They forecast 18 factors:
Gross Domestic Product oil price
consumers' expenditure employment growth
general Government consumption unemployment
gross fixed investment industrial production
stockbuilding manufacturing output
exports world trade
imports current account
Retail Price Index Sterling index
average earnings short-term interest rates
A similar, but generally more expensive, averaging approach can be taken for micro-economic forecasts in some industry fields by buying a number of standard reports from commercial market research companies. Regular reports are produced for some industries such as telecommunications
Applications
Typically macro-economic assumptions are needed for strategic and business planning.. They may also be required for product planning and special projects. In addition micro-economic forecasts and many individual pieces of data needed for these purposes require validation by fitting in with a set of consistent macro-economic forecasts. Preparing these properly is often beyond the ability and scope of an in-house team and the use of published forecasts solves this problem as well as being cheaper than the cost of the otherwise necessary in-house economists.
The use of published forecasts is often desirable also when line managers have their own strong views on such matters as likely wage inflation and see no reason to defer to a lone in-house economist . Equally the "legitimacy" of external sources is desirable when line managers wish to use distorted forecasts to justify their plans.
Evaluations
Use of outside forecasts will of course be made by any internal economic team. Indeed the "independent" forecasts covered by the Treasury and Financial Times lists are made by economic groups who also look over their shoulders at what other forecasters are saying and modify their figures if necessary to avoid being too much out of line.
Nevertheless formal use of external forecasts gives greater consistency and legitimacy. Past performance of the various forecasts can be monitored to give an indication of standard error or other measure of accuracy to be assumed.
In theory examination of past forecasting accuracy could suggest that certain forecasters should be omitted from the averaging process, but this course is not recommended in view of the divergence of, basically unproven, economic theories used.
A final warning may be necessary. The ensuing partial consensus has been badly wrong on occasions; for example the onset of the UK recession around 1990 was underestimated by most economists, even when observation within industry showed a rapid slow down in activity
Further Information
The two main sources, The Treasury and The Financial Times, have already been mentioned. Most other sources will be industry specific: market research companies such Frost and Sullivan and Ovum are examples.
Author
Donald Alexander - 10 December 1993
HISTORICAL ANALYSIS
Identification of structural constants and deep seated trends through looking at what has happened in the past. One of the ways of providing the starting input into Scenarios.
Description
There are a number of different approaches. Sociology developed Historical Analysis in the 1920's - 30's. The method was to take stages of economic development from the simplest tribes to the present day, and write down a summary of what was going on for each stage, for the topic you wished to explore. The objective is to see what long running pattern emerges in the development of the topic. This method specifically looks at what happens if human economy develops and grows. If the economy is static (as it has been over the great part of man's history) the assumption is that not much fundamental changes, anyway over the span of a human life.
If the human economy goes into a long term decline - as it has done nearly as often as it has had long term economic growth - one can study the breakdown of a civilisation.
Herman Kahn and the Hudson Institute relied heavily on History in developing their long term projections. Kahn would say publicly in the 1960's - 70's that one cannot be in the forecasting business without a sound knowledge of History. Not much is publicly known of the exact methods they used.
Applications
Most consultants offering Scenario Writing and Planning (q.v.) state somewhere that they use Historical Analysis in the process, but again their detailed methodology is generally not made public. Historical Analysis is the fundamental starting point for a Scenario in any area. The Study Group thought that this approach was of great assistance in Scenario Writing.
Limitations and Evaluations
The method does need a sound knowledge of history and archaeology, and anthropology (main source of information of the lowest economic levels). As most people will lack this, expertise must often be brought in - though should be available in most local colleges.
Not all topics can be dealt with in this way - especially where the topic does not have much history. It works best for fundamental activities of man - because these go back to his beginnings (the writer only takes the latest sub species of homo-sapiens, Cro-magnon man - who's been around for only 30,000 years). If one wants to look at something more specific, it is best to look at the more fundamental activity which embraces it. One may then find that the more specific is playing a particular role in the wider society.
Cases
The writer gave an account of the method he used in constructing the Business Trends Library (see further information). The business environment is divided into 10 Areas, and each Area is divided into a number of Sectors - each Sector being a fundamental activity of man. Each sector is analysed under the Stages of Economic Development, following (generally) the conventional Sociology scheme: Food Gathering, Agriculture, Simple Technology, City State, Empire (Roman): then a discontinuity into the Dark Ages where human economy declines, followed by Medieval, Industrial Revolution, Consumer Society, Mass Production Society, Post Industrial Society (generally the subject of the forecast).
In nearly all Sectors a clear statement emerges of the constancy of what has gone on in the development of that Sector. It is a reasonable assumption that this constant process will operate over the next decade or two (the usual planning time horizon) and so forms a starting point for a Scenario for the Sector.
Inter-action with other Sectors in very important - see Cross Impact Analysis - a problem is that many people do not look wide enough and surprises come from areas they have not looked at.
Further Information
Richard Whaley, Data Bank on the Future Business Environment Long Range
Planning 17, 83 1984
Interactions and impacts among business futures Futures
June 1985, 17, 269
Richard Whaley December 1993
NORMATIVE FORECASTING AND RELEVANCE TREES
Forecasting in reverse - decide where you want to go, then work out what you need to do to get there. Relevance Trees are a procedure for writing down these actions and their inter-relation.
Description
Normative Forecasting was first used on a wide scale at NASA, in planning the space programme, and getting men on the moon. The objective was set politically, but a large number of technologies necessary did not exist when the objective was set - nor was it known what the technological requirements were in detail.
Relevance Trees can be described as Decision Trees in reverse - the flow being in the other direction. The Relevance Tree was a central part of NASA's Normative Approach, shown in the Figure. PATTERN was a relevance tree scheme developed by Honeywell. Starting from the US's National Space objective, it breaks what has to be done into a hierarchy of levels, ending at the bottom with over 2,000 technological deficiencies, which had subsequently to be created through R & D Programmes. Here, therefore, these techniques are being used as Technological Forecasting devices - but their role is not confined to this.
Applications
This approach has a role in strategic planning in developing what has to be done to achieve a certain objective or goal, or potential objective. Forming a Relevance Tree is generally a good idea for any forecast to check what has to happen for the forecast to come about, and are a good way of obtaining a realistic time scale for how long things will take to happen.
The Group thought there was scope for these methods in Project Management and software development - and generally at the tactical as well as the strategic level.
Limitations and Evaluation
These methods can be used where there is lack of or missing data which generally hampers other forecasting methods - since these methods are designed to identify what is missing, and start the process of filling the gaps. Border line techniques between forecasting and planning - but essential to both.
However it cannot be used where you have no goal, or potential goal, to explore.
Further Information
Technological Forecasting in Perspective by Erich Jantsch (OECD Paris 1967)
Richard Whaley December 1993
Figure PATTERN relevance tree developed by Honeywell applied to NASA Apollo programme payload evaluation. Goals known, but problems must be specified. Adapted from William S Beller "Technique Ranks Space objectives" (Missiles and Rockets - February 1966). This Figure was presented in this report, and is available from Erich Jantsch, Forecasting the Future, Science Journal Vol 3, No. 10, October 1967, p41. Science Journal was published in London.
APPLICATIONS OF METHODS IN PRACTICE
Virtually all management decisions involve taking a view about the future, ranging perhaps from a few hours to over twenty years.
Thus decisions rely on forecasts, either explicitly or - it seems from our investigations all too often - implicitly. It is possible to argue that the most commonly used type of forecast, extrapolating recent trends (of market size etc.), is based on an underlying assumption that there will be no changes that make the future different from the past. This is an unlikely assumption. It is suggested in the Trend Extrapolation section of this report that the use of Trend Extrapolation on its own is dangerous for this reason.
We found no consistent pattern of how organizations are using forecasts.
Actual practice tells us little about how to optimize the use of forecasting methods. While there is quite a lot of literature on individual forecasting methods, the study Group considered that the real art was in using a portfolio of methods for particular problems.
There seemed, however to be a dearth of such practice - except in the field of scenario planning (here however it was also recorded that: It was not possible to ascertain exactly how these consultants used these methods in concert, and no doubt much depends on their experience and ingenuity). A number of meetings were devoted to this, and in the Seminar in 1990. It was concluded that the state of the art of using a portfolio methods did not exist. One must create ones own, using common sense. The rule should be that one method on its own is seldom satisfactory. In the review of the Forecasting Methods we have set out where one method needs others methods. This is the starting point in building a portfolio of methods for a particular problem.
A rational approach boils down to making a (perhaps rough) assessment of the value to be obtained from, and the expense to the organisation, of using various formal methods.
Very often an early assessment should be made of any accuracy that might be achievable. Each organisation needs to make it own assessment in relation to the decisions to be made, using Decision theory, of
how valuable forecasts would be for the particular purposes it had in mind
how important is the decision under consideration
how accurate is the forecast desired to be
how much data is already available
how much cost can be afforded, or justified
how much time can be afforded or justified
how much accuracy is likely to be yielded by the various methods in the circumstances
On the question of cost in the above list , the study Group considered some mention of Decision Theory needs to be made. Decision Theory is a well established tool, and a brief discussion of it is given below, related to the 'decisions' which have to be made about how much to spend on Forecasting.
Decision Theory
Decision Theory, while not a forecasting method, has a part to play in deciding if it is worth undertaking further forecasting. Most people are familiar with Decision Trees.
[ A brief account of Decision Theory and Decision Trees was given, readers of this on line version are referred to the References. Here the concepts of the Cost of the Decision and the Cost of Information are discussed.]
Quite often a different outcome may appear better when Uncertainly Envelopes are applied. It is then possible that the Decision can be improved if the uncertainties are narrowed. One can work out from the Decision Tree what is the value to be gained from narrowing the uncertainty - known as the Cost of the Decision. This analysis will also indicated which probabilities and outcomes needs to be re- forecast. Projects can be planed to do this, with an estimate made of their cost - which is called the Cost of Information.
Logically these re-forecasts are not under taken if the Cost of the Information exceeds the cost of the Decisions. It may be quite likely that the best decision has not been found - but the cost of re-forecasts is likely to outweigh the better Decision. It is surprising how often mistakes are made here - as cited under market research.
Initial forecasts may not cost much - but the costs of reducing the uncertainty often rises rapidly. Another approach, especially in the longer term strategic decisions, is that uncertainty will often narrow as the future comes closer to you. You may not have to take all the Decisions at the start - it may be possible to re-value the Decision Tree at the future points in time. It needs to be evaluated when Decisions need to be taken in the light of lead times involved. This can also help to set up procedures to monitor certain information and trends which have been identified as critical. These are often easier to do over time rather all at once (see Strategic Data Bank in the next section).
More advanced forms of Decision Theory deal with Utilities not money. Utilities deal with the fact that human's valuations of money is not linear - especially in the risk of loss or bankruptcy. Going into utilities is beyond the scope of this report, reference is made to further reading. The point can be made that a Decision which has a significant risk of a £ 50M loss will be reviewed very differently by a large multinational corporation who could stand the loss compared with a firm which would be bankrupted by it. The Decision Trees would be the same in both firms - unless the non linear relationships to money is incorporated in the form of utilities.
The logical strategy is for firms to maximise their expected utility. Studies have shown however that mini-max Strategies are often employed - they minimise their maximum losses. This arises because firms do not set out the problems fully - especially between different management levels.
Environment
It may be desirable to make a preliminary assessment of how stable the environment is likely to be, and what types of uncertainty are likely to encountered. This helps to evaluate the state of change that could occur. It may be possible to construct Uncertainty Envelopes if some theme exists to these changes.
It is worth realizing that some changes can be random 'a roulette wheel' problem. Here no amount of increased forecasting will narrow the uncertainty. These outcomes need to be met by suitable contingency plans.
Most forecasting methods require an adequate supply of past data to be useful. Even trends graphs should use as long as span of past data as possible - at least as far as back as is being forecast forwards.
One should never be mesmerised by the suppose accuracy of a forecast, whatever its source. Single line forecasts can be dangerous, as discussed under Trend Extrapolation. These should be converted into Uncertainty Envelopes - which is a more valuable presentation. Some forecasts are more reliable that others: e.g. the Uncertainty Envelopes for the population of ten year olds at some future year is quite small - especially if they have already been born. While the Uncertainty Envelope for the take up of domestic on line information services over the same time horizon will be quite large.
Least costly forecasting methods are likely to be
- Trend Extrapolation (data often exists within the organisation)
- Averaging published forecasts
More expensive and lengthy methods are generally
- Market Research
- Delphi
- Economic Modeling
For short term forecasting Trend Extrapolation may be adequate - but potentially dangerous if the there has been exponential growth or if a "S" Curve saturation effect is present - when it needs to be backed up with modeling and Product Cycle Analysis
Longer term forecasting is necessarily more speculative: Modeling, Envelope Curves, Scenarios, Historical Analysis and Delphi methods may be used in concert. Where appropriate, they are generally backed up by significant market research.
It is recommended that, where possible, at least two methods are used, to give credibility and a check on any forecasts.
It is also recommended that all organizations should make regular assessments of
- external factors which might have a significant impact on the organization
- current and potential competition
These may be essential for survival.
Further Reading
D V Lindley Making Decisions Wiley 1971 - 85
H Raiffa Decision Making Addison - Wesley 1969
C J Grayson Jr Decisions Under Uncertainty Harvard Business School, Boston
D A Alexander
October 1995
USE OF BUSINESS ENVIRONMENT INFORMATION
It was an objective of the study to identify the best practice in how to use Business Environment Information in strategy formation. It was hoped this would lead on naturally from the last topic - Applications of the different methods.
However, no best practice emerged on how to use the various methods on common problems, nor how to build up a picture of the Future Business Environment. Its not surprising therefore that no best practice emerged in how to use Business Environment Information - but that practice on this was rudimentary. It is doubtful if many firms attempt to use the forecasting methods in concept to develop a comprehensive picture of the existing and future Business Environment, for which it must follow that accepted practices on use have not been developed.
The practices which were given came from consultants - which may be the main form of delivery. Whether firms take such information occasionally, or having obtained it keep it up to date and use it regularly is not clear. But from the lack of hard examples being given from members in the meetings or 1990 seminar it is possible that regular use of Future Business Environment Information in strategy formation is not too common.
This position is borne out by the literature. Jain reported in 1984 that Environmental Scanning in US corporations tended to have 4 phases. The 1st phase was scanning and clipping publications for relevant information. This process was refined over Phases 2 and 3, to predicting the future form of the Business Environment relevant to the corporation in Phase 4, and looking out for competitive advantages. There was found a marked connection with the phase reached, and the size of the firm. Over $5b turnover more were in the 4th phase, and none in the 1st phase. Between $1-5b (1984) T/O more were in the 3rd phase. While under $1B most were in the 1st phase and none in the 4th phase.
Translating this into the UK, only the top 200 firms may be large enough to be in the 3rd phase, and the top 50 mainly in the 4th phase. The UK may lag behind the US.
In 1987 Payne and Lumsden reported that firms which have analysed their competitors and the evolution of their industry and what's driving it are virtually nil. The future Business Environment, and an explanation of the future, are part of the strategy process, but forming the growth of strategy consulting.
It is worth remembering that planning arose from military planning, itself the result of 10,000 years of warfare. The terms are all military in origin, objective, strategy, tactics, reconnaissance. These principles have only been employed in business organisations since WW2 - partly due to the mass training of men and women in military matters during the war, coupled with the growing size of business organisations.
Reconnaissance may not be so familiar in corporate planning as the other terms; OED: military or naval examination of tract by detachment (of a reconnoitring party) to locate enemy or ascertain strategic features; a preliminary survey. In the business organisation context these activities are succinctly put by Payne and Lumsden two paragraphs above - which both they, and Jain say is not being done, except perhaps in the very largest corporations of the world. This study, both in the late 1980's, and its review over 1993-4, must conclude the same thing.
Any school boy who has been in his school Cadet Force knows you cannot form Objectives, Strategy or Tactics without Reconnaissance. The hard evidence before us is that Reconnaissance in the form distilled by Payne and Lumsden, which we are attempting to discuss in this section, is not being done. It follows from this that much of the corporate planning cannot be effective planning at all.
Much has been written about Strategic Management over the last dozen years, supposedly embodying the most up to date procedures for Strategy formulation and action. Even our own Society Journal incorporates it into its title as an addition to the dated concept of 'Long Range Planning'. The author's perception is that the role of Forecasting the Future Business Environment has been growing in Strategic Management over the years. Among the various schemes on offer, the following makes a starting point of a Business Environment Forecast, after which the following six steps are taken:
1) Impact of the Environment on the firm: the relation of the performance of the business to the forecast future conditions, and refining both. The industry and market growths and contractions, the product cycle portfolios, competitive positions, industry structure, technology trends, substitution and other mechanisms. Conclusions on the need for change, its urgency, and possible forms the change could take. In order to do this it may be necessary to establish a ...
2) Strategic Data Bank: ... additional information necessary, data which needs to be monitored regularly. May include historical market data, market share and competitor analysis. The data bank will be added to as time goes on. A sound information base is needed for strategy.
3) Decision Making: Experience is that a different decision making process is needed from that used for operating decisions. Management must come to conclusions on
- Performance of firm in future environment
- need for change and its urgency (if any)
- form the changes may take in terms of opportunities and alternatives
i.e. Alternative Strategies
4) Capability: Some 20 capabilities needed to plan, decide and implement change
and innovation. Assessment of those available, and those required.
5) Scheduling actions within Capability: actions which are definitely needed
where capabilities exist go ahead at once. Otherwise ...
6) Strengthening Capability: ... actions are directed at strengthening or
installing capabilities that are needed. Realistic time scales can be long.
This scheme is largely the creation of academics but does give a logical and central role to the use of Future Business Environment information. Since I believe we are on firmer ground if we follow the 10,000 years experience in military planning it is instructive to asses these six steps against military planning. Step 1 is common sense. Step 2 is well known as the Military Intelligence Departments of modern times (MI 1-6 CIA, KGB ...) - who's equivalent is clearly lacking or underdeveloped in modern business. Step 3 is common sense - any War Minister or General with proper Intelligence will go through this process. It is difficult to find the Military Planning equivalent of step 4 - baring the obvious that no Pirate Captain would contemplate attacking a 100-gun ship of the line. Thinking this way, nearly all civilisations have eventually been over-run by superior military forces. This might be taken as a failure of Capability - for which that Civilisation has paid by the loss of its lands, lives and freedom. But it might also just be regarded as a loss of competitive position. Capability is something more. Military organisations are usually very highly trained and only take on tasks within those capabilities. Despite Icarus, armies do not generally contemplate becoming Air Forces, yet business firms do - though they are (probably) less highly trained. The disastrous record of firms' diversification (and their continued attempts despite failures) must bore in on the academic mind that firms need to be restrained from undertaking things that they are not capable of. Conversely, firms must have overestimates of what they are capable of doing outside their immediate experience. Thus assessing Capability is a necessary step given modern firms inclination to go off in several different directions. Steps 5 and 6 logically follow. The jury is certainly still out at to whether firms are learning the Capability lesson.
We return to the hard evidence before us that very few firms are undertaking their Reconnaissance nor forming their Military Intelligence. Thus, no matter how logical such a Strategic Management process may look, without the proper information input it cannot be expected to work. The issues of analysis and forecasting the Business Environment, and the operation of a Strategic Data Bank, may be the biggest challenges facing planning - if there is to be effective planning in business at all.
The Study Group thought that at present the trend is for decentralisation, with reduction in Head Office staffs who do this sort of work. Thus the trend may be for less attempts to produce a future Business Environment picture as many firms believed it impossible to do. Instead firms purported to intend to react by being more flexible.
This was an old debate, and it was very doubtful if firms were capable of showing the necessary flexibility even when a realistic picture of the future Business Environment had been developed. As argued above, firms are not capable of changing course, without long lead times to develop the necessary Capabilities. Most modern firms are pretty well frozen on the course they are on, and need sizeable lead times to embark on another course. The only way they can obtain the necessary lead-time is through Reconnaissance, Military Intelligence, which is likely to centre on a Business Environment Assessment and Forecast.
An example was discussed from the Computer Industry, where the modern computer firms were reacting fast. Thus a new PC may be brought out in two years - hence arguing that reacting so quickly obviated the need to look ahead. Unfortunately, it was admitted that the success rate for such computer firms was poor - many such rapid reactions were failures. Corporate failures may follow the failure of a new PC, and like the sacking of an ancient city state, is a failure of at least one of the steps of (military) planning - (military) Intelligence generally being one of them.
The argument proceeded as follows: it costs about £50m to bring out a new PC in 2 years. That PC would expect to be in the market for somewhat longer. If it does not sell in sufficient numbers for sufficient time corporate failure may result. We are already talking of a timescale of 5 years, conventionally regarded as long term, over which Environment assumptions are made and assumed to be favourable to the new PC. To spend less than 1/10% of the £50m on a relevant Business Environment Forecast may tell you the Uncertainty involved in success and failure, and give a risk figure essential for a strategy to avoid Corporate failure. Decision Theory may indicate how much it is worth spending on a Business Environment Forecast. The Theory can also deal with the risk of Corporate failure - which is critical to the size of the firm. A £50m or more loss may be an acceptable risk for a very large firm, but could cause a smaller one to fail - the strategies of the two firms will be very different.
The trends since the Pain and Lumsden paper may be that more Business Environment information is provided by Consultants, and less by in-house staff in firms. This may be more efficient in several ways. Consultants will look wider and have more on-going experience of differing industries - thus can be expected to see more of the surprises coming from unexpected places. Also, the consultant is in a better position to bring bad news. The in-house man may blight his career by doing so. This is a real problem in modern business. In the time of the Roman Emperor Commodus it was death to approach him with unwelcome news. Most of the City States were more practical in the use of their Military Intelligence - their survival depended on it.
References
Jain S.C. Long Range Planning - 17, No 2 April 1984
Pain & Lumsden Long Rang Planning - 20, No 3 1987
Richard Whaley
August 1994
STUDY GROUP MEMBERSHIP
The Study Group Membership List during the 1988-9 Forecasting Study contained about 100 people. A substantial proportion do not often attend - but members can keep in touch with the discussion as a report on each meeting is sent to all members - who in turn can send in written comments thereon.
Few people can come to each meeting. The following is a list of members who make a regular contribution to the study or part of it. Selection of names is necessarily arbitrary - and others not named have made contributions - especially invited speakers from outside the group.
The organisations cited are mainly those for whom the members worked at the time of the Study. In some cases the organisations are corporate members of the society.
Richard Whaley (Chairman) Director, Planning & Control Investments Ltd
Donald Alexander Independant Consultant, Dacon Associates
Peter Brown Chairman, Rhopoint Ltd
Brian Burrows (Minute Secretary) Senior Consultant, Futures Information Associates
John Crawford Developement Manager, North West Thames RHA
Derek Done Economic Research Manager, British Airways
Stephen Gard Management Accountant, Kleinwort Benson PLC
Tony Gill Management Consultant
Jeffrey Holden Market Services Manager, Dexion Ltd
Peter Maddock Membership Officer, CBI
Dick Martin Lecturer, Ealing College
Geoffrey Morris Director of Research, Inter-Matrix
Stan Skoumal Stan Skoumal Imports
David Skyrme (Secretary) Strategic Planning Manager, Digital Equipment Ltd
Peter Ward
Michael Watson Director, City Venture Brokers Ltd
The Business Trends Library Home Page